I like to create illustrations of science to help communicate complex physics, particularly that of the research I do. I use these images in science and outreach talks. Below, you can find some examples of my work.
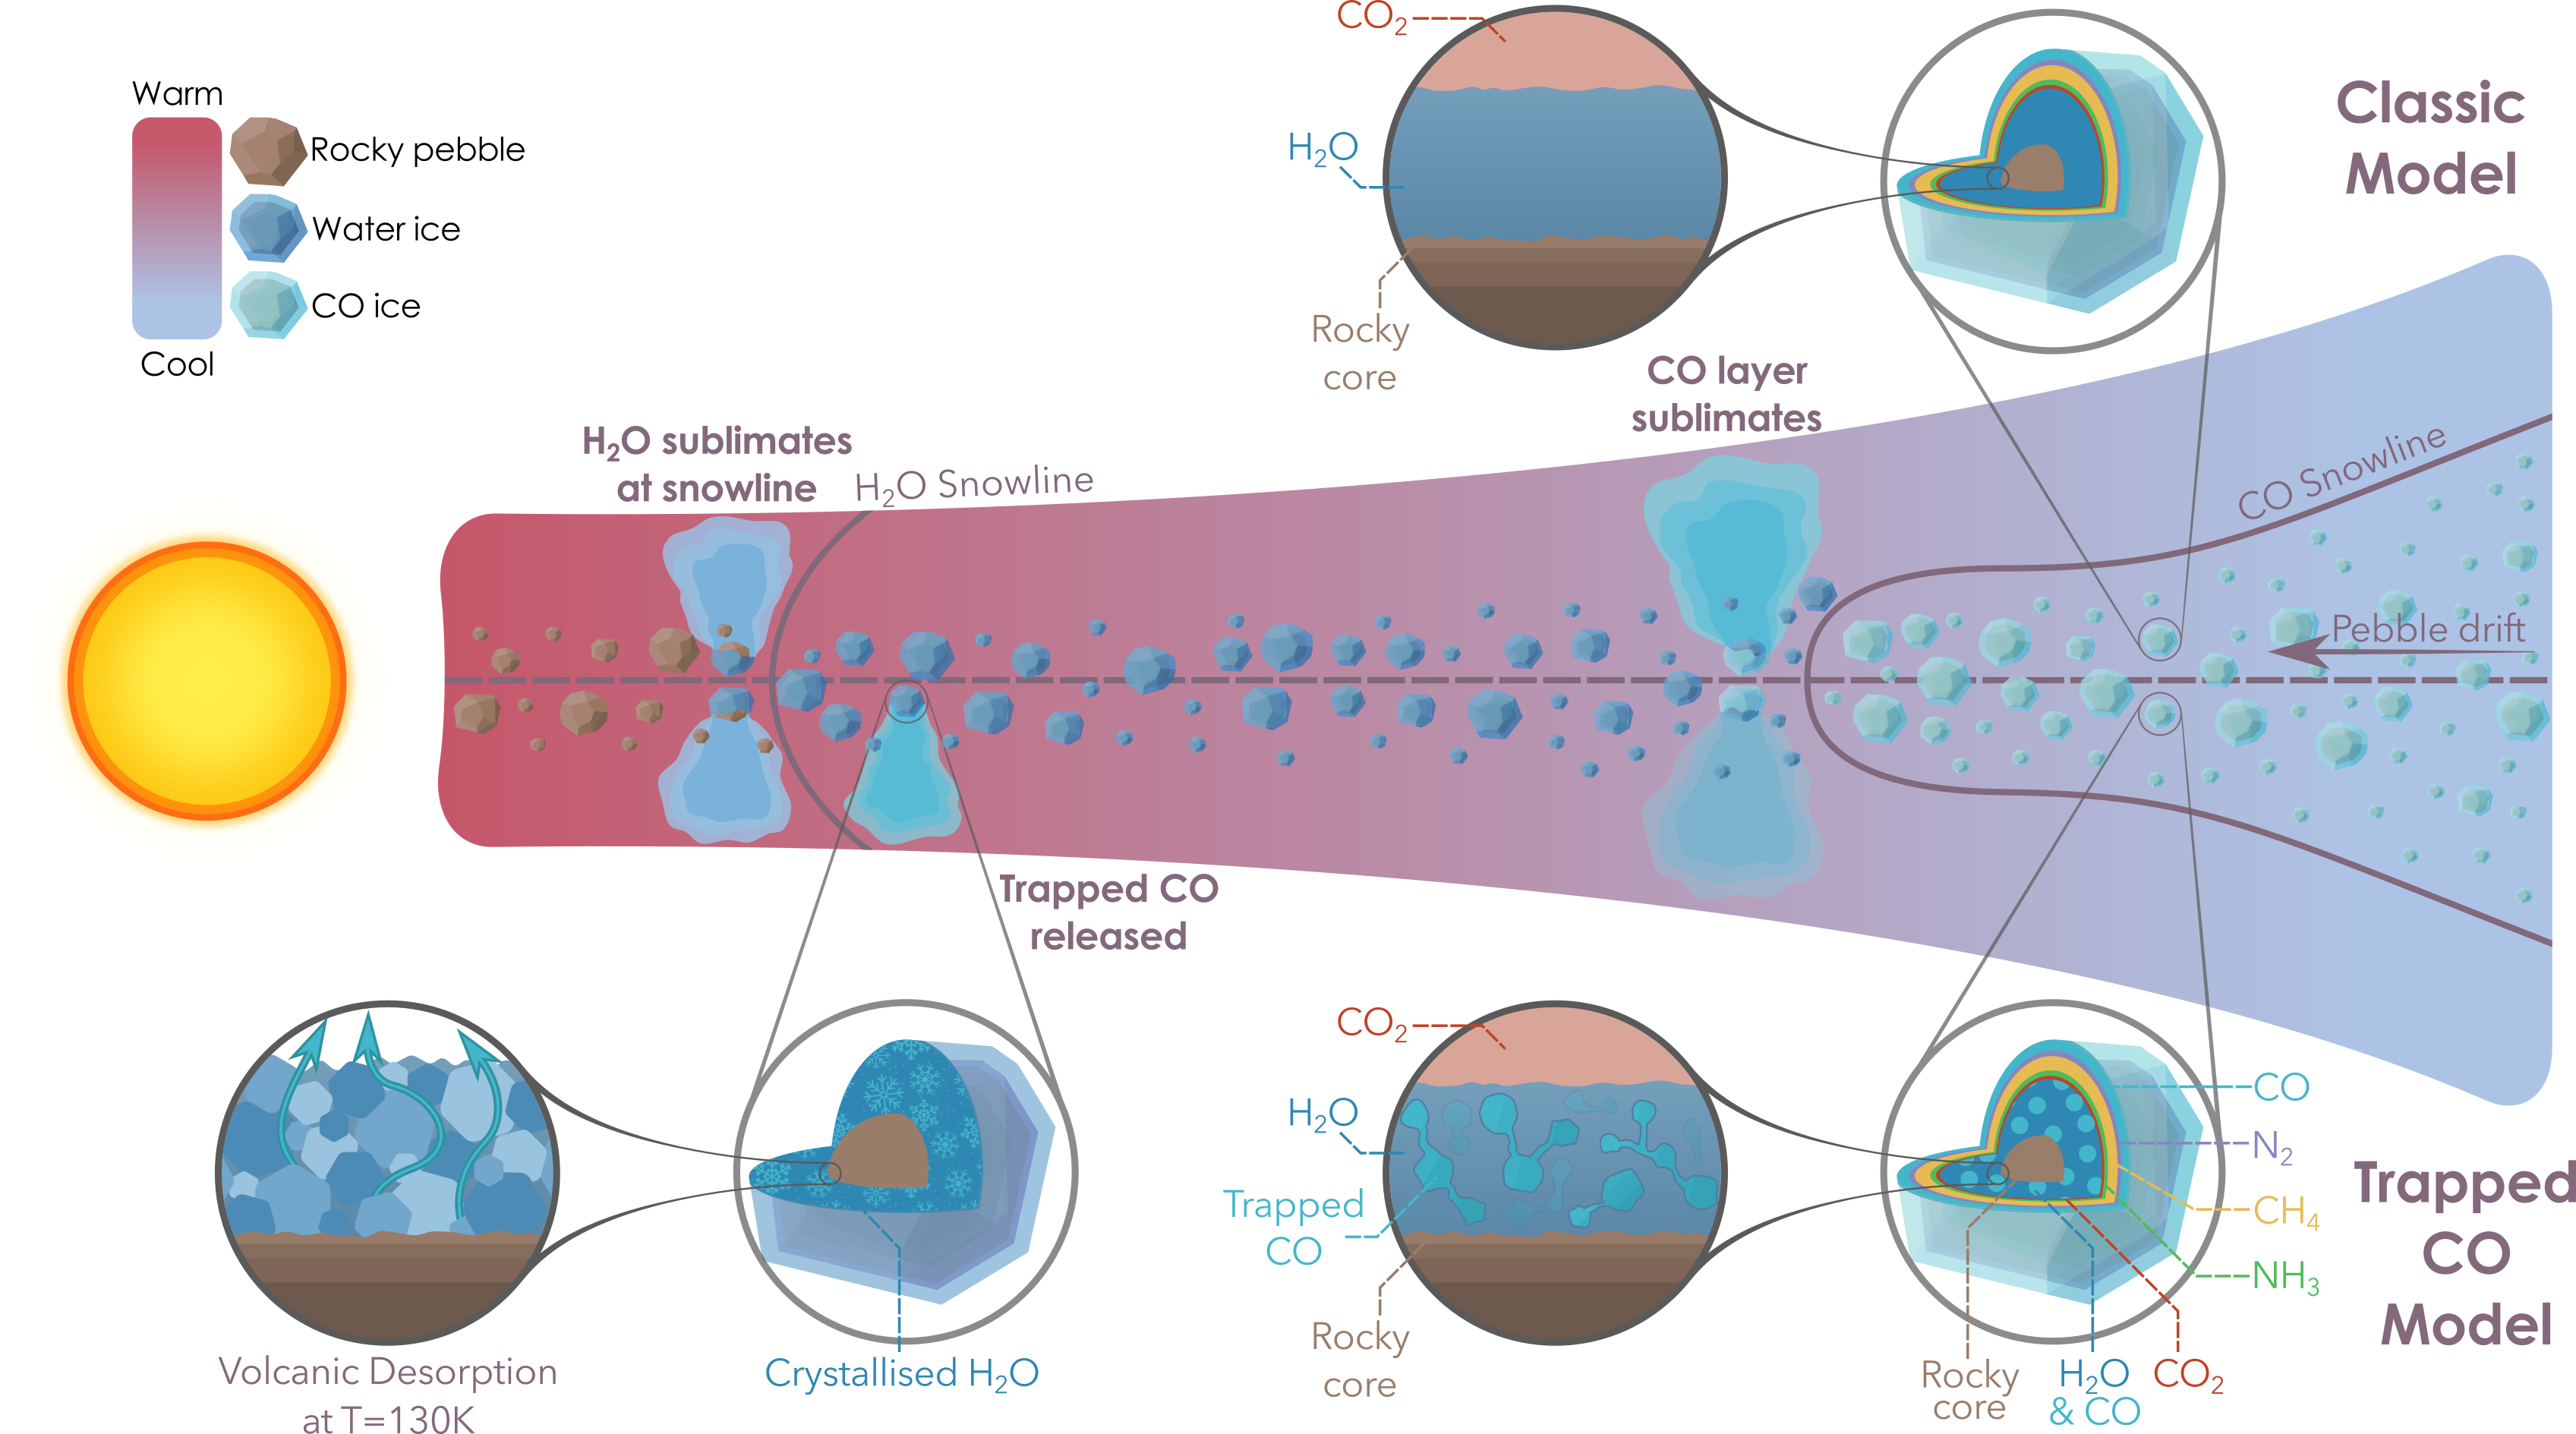
I made this diagram for Figure 1 of Williams et al. 2025, showing how classic pebble drift models contrast with our new volatile entrapment model. Typical volatile transport studies model CO as sublimating at only its snowline at 60-70 au; the entrapment of CO inside water ice, however, means that up to 60% of the CO budget can be released just outside the water snowline due to crystallisation of water ice.
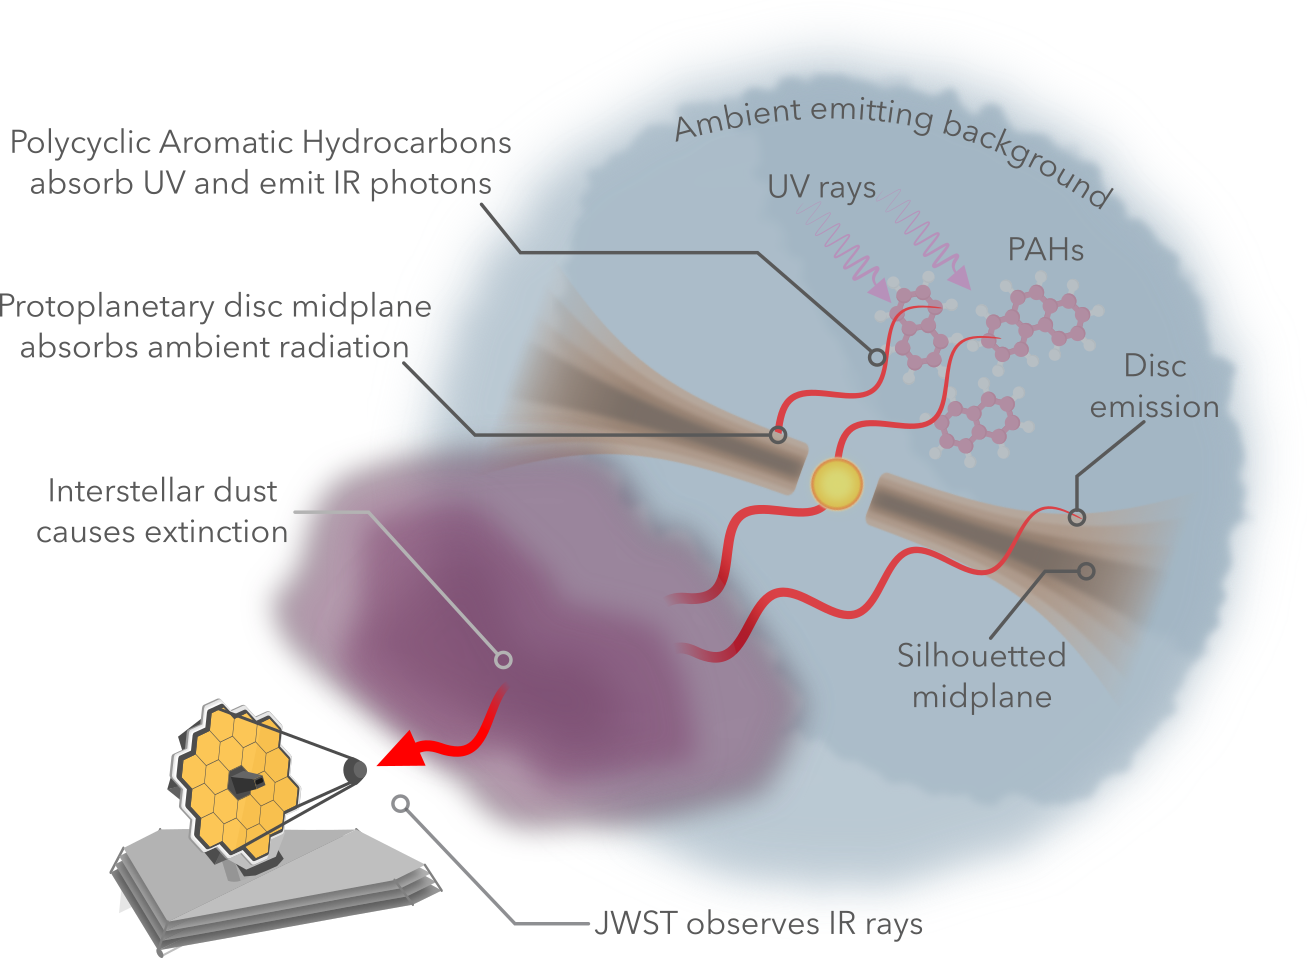
I created this schematic for an Astrobites article I wrote, which details the scenario in which JWST observed the Flying Saucer protoplanetary disc, as outlined by Dartois et al. 2025. This was inspired by their Figure C1.
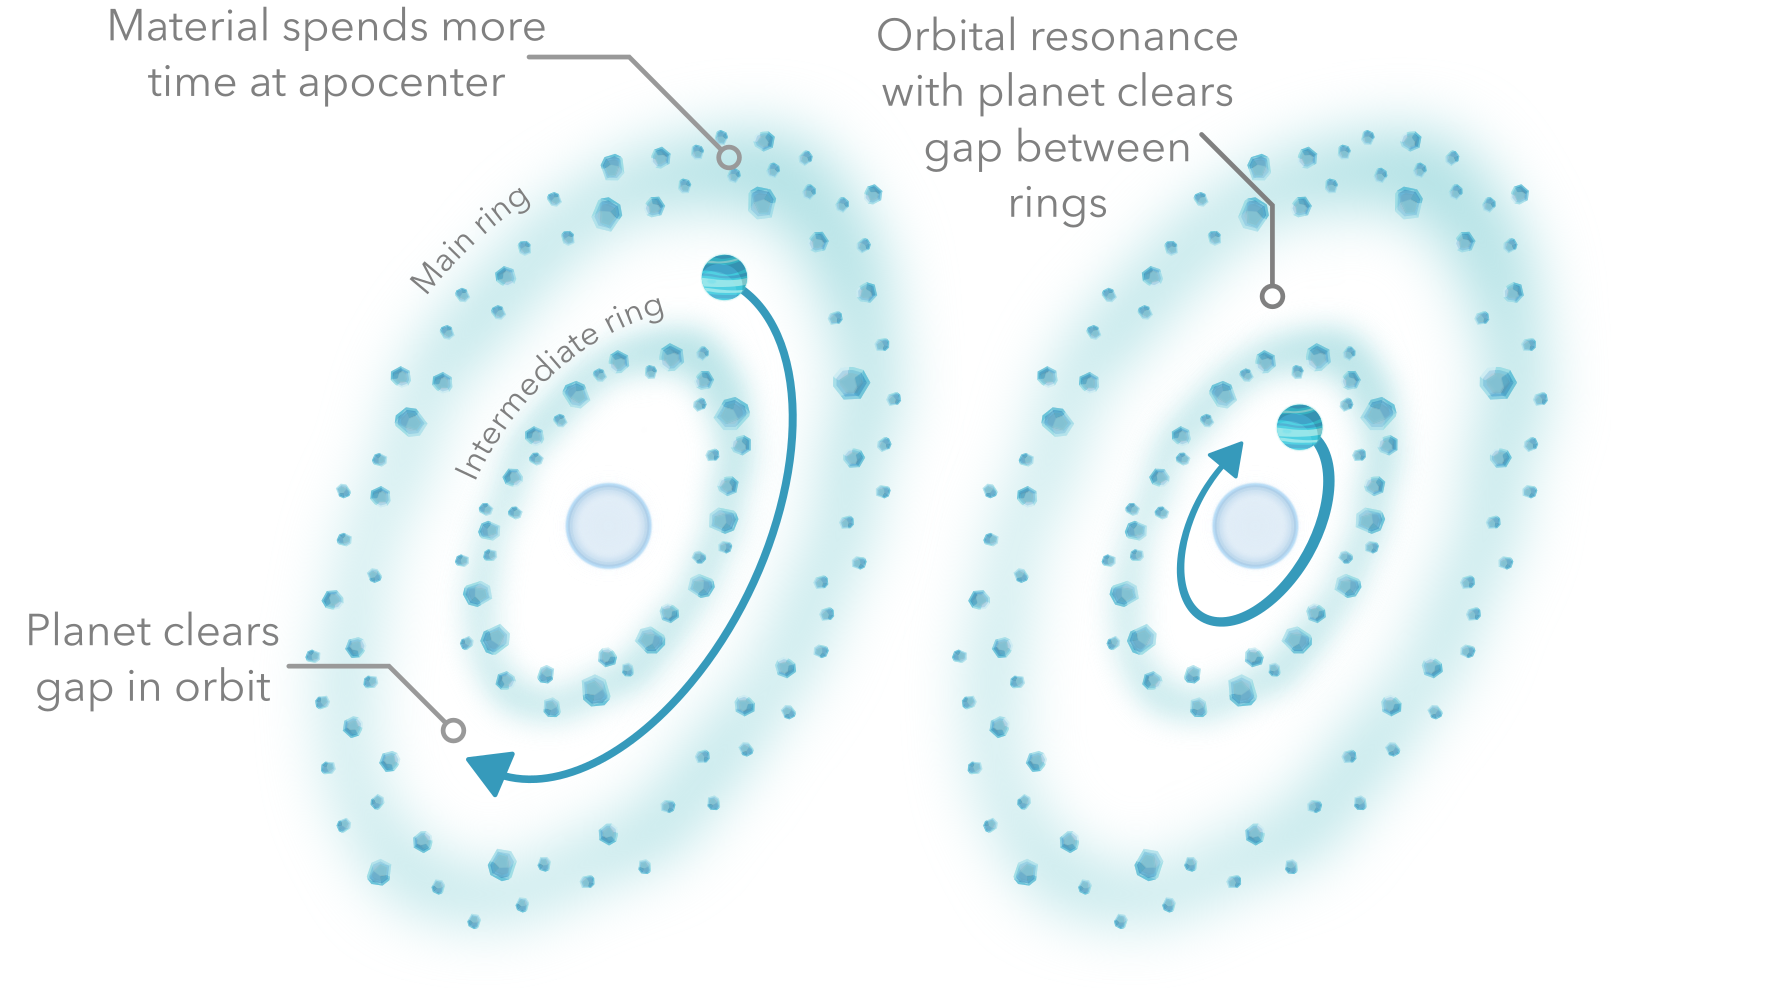
I created this schematic for an Astrobites article I wrote, which explains the possible planet-based scenarios that could have carved the Fomalhaut debris disc, as suggested by Lovell et al. 2025.
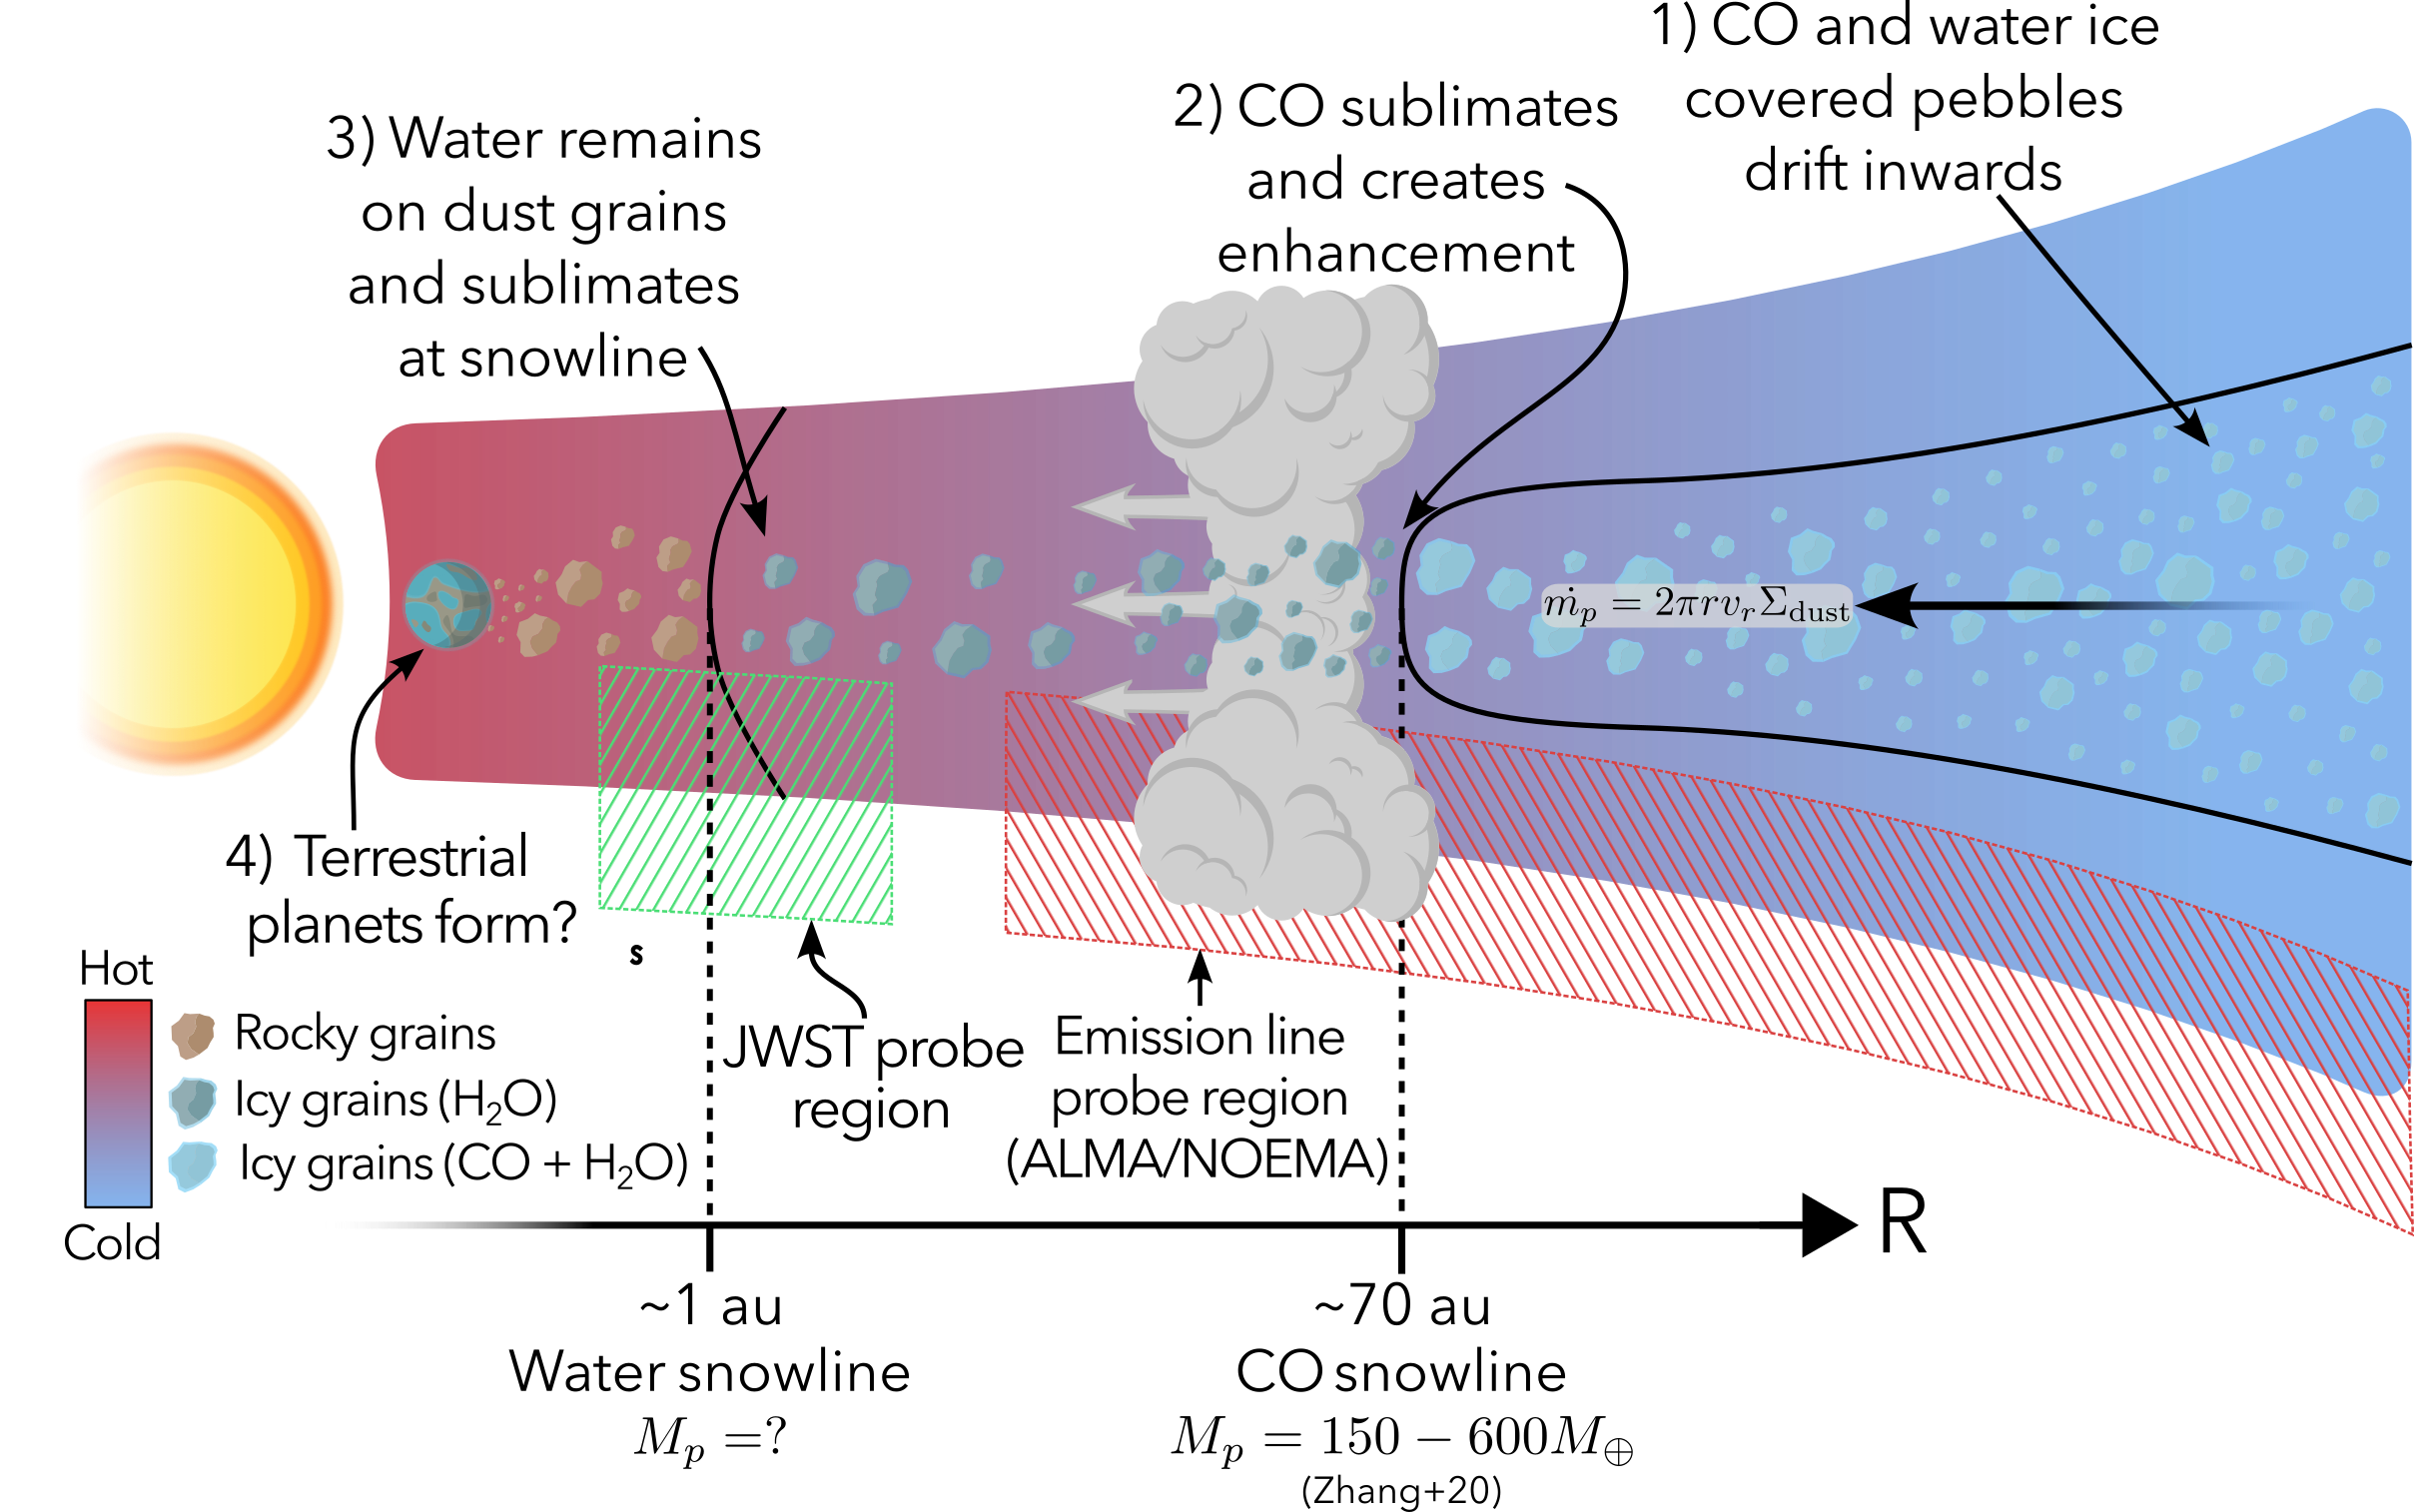
I created this schematic for Figure 1 of Williams & Krijt 2025, which illustrates how icy pebble drift creates enhancements in the CO abundance around the CO snowline. The pebbles continue to the inner disc and sublimate their water, available for terrestrial planet formation. The schematic indicates where telescopes (JWST, ALMA, NOEMA) can observe in the disc.
You can get a higher quality version of this image from the graphics page for the paper on ADS.
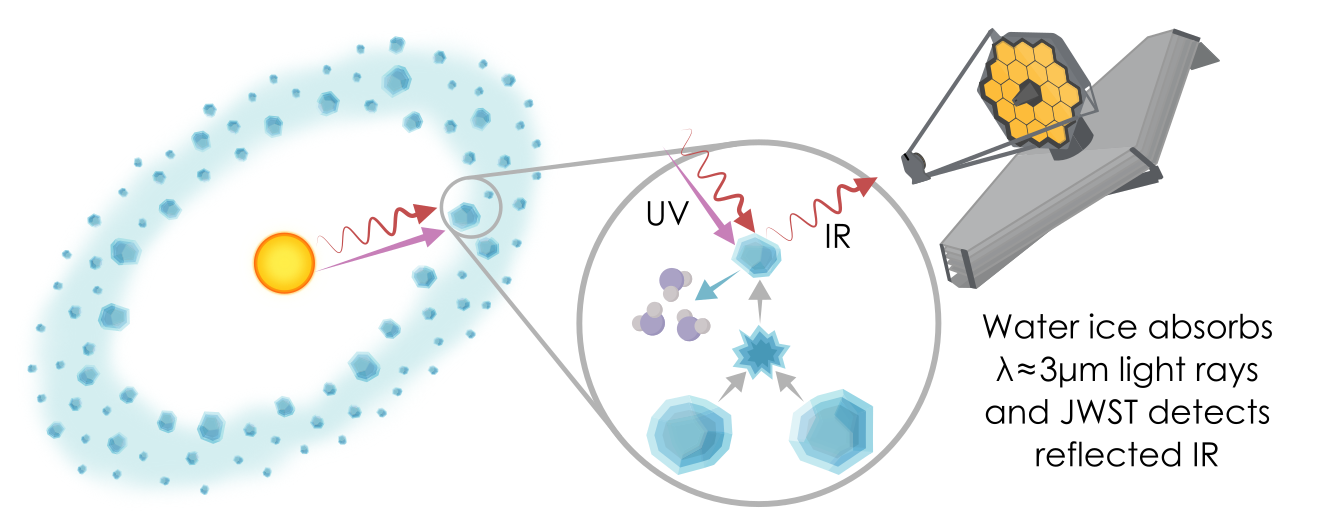
I created this diagram to illustrate the physics and first detection of water ice in an exo-Kuiper Belt, used in an Astrobites article I wrote. Infrared radiation is reflected off water ice, which creates the reflectance spectra that Xie et al. 2025 used to detect water ice. The UV from the star photodesorbs water from the small grains; small grains are replenished by collisions between bigger grains.
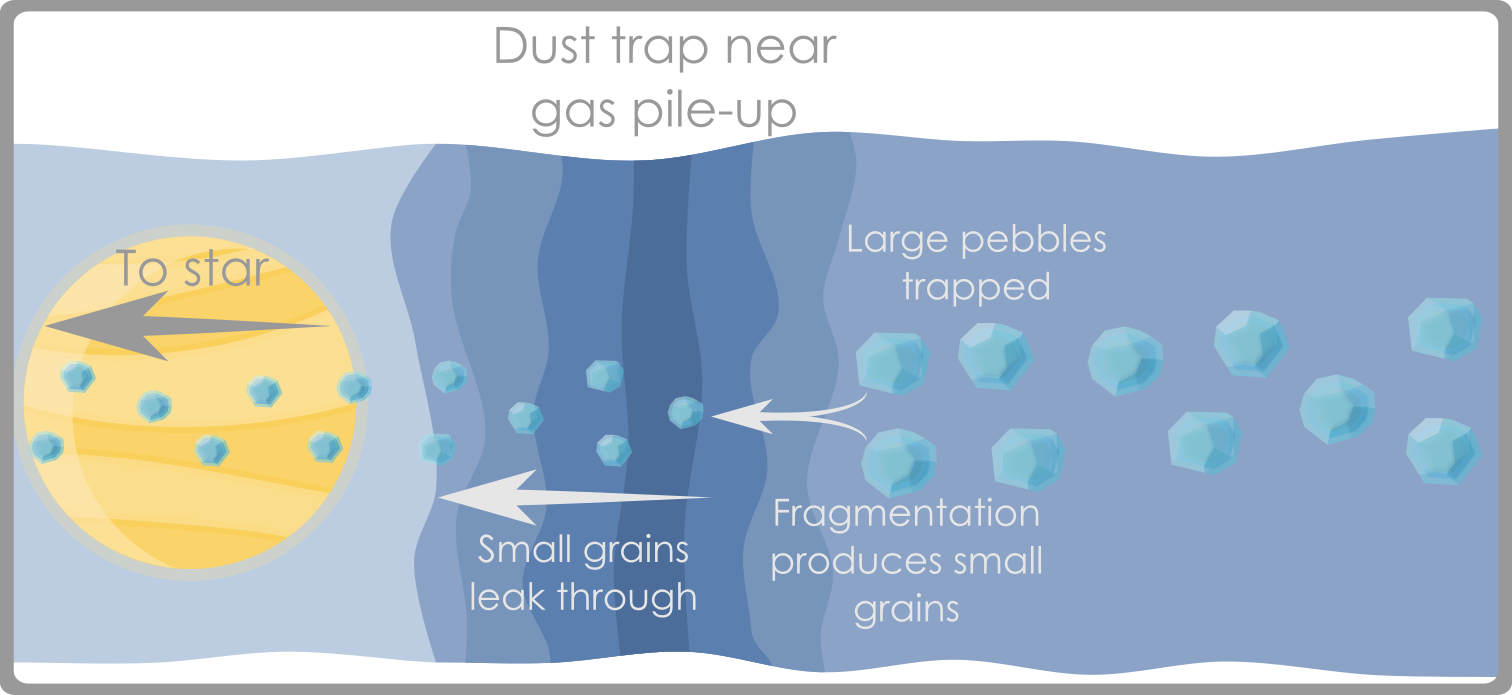
I created this diagram to illustrate the physics of a leaky dust trap that has been inferred to exist around PDS 70, used in an Astrobites article I wrote. Small dust grains have been inferred to exist closer to the central star than larger dust grains, using ALMA Band-9 observations by Sierra et al. 2025. This implies that small dust grains can escape the planet-induced pressure bump that traps larger pebbles, halting radial drift.
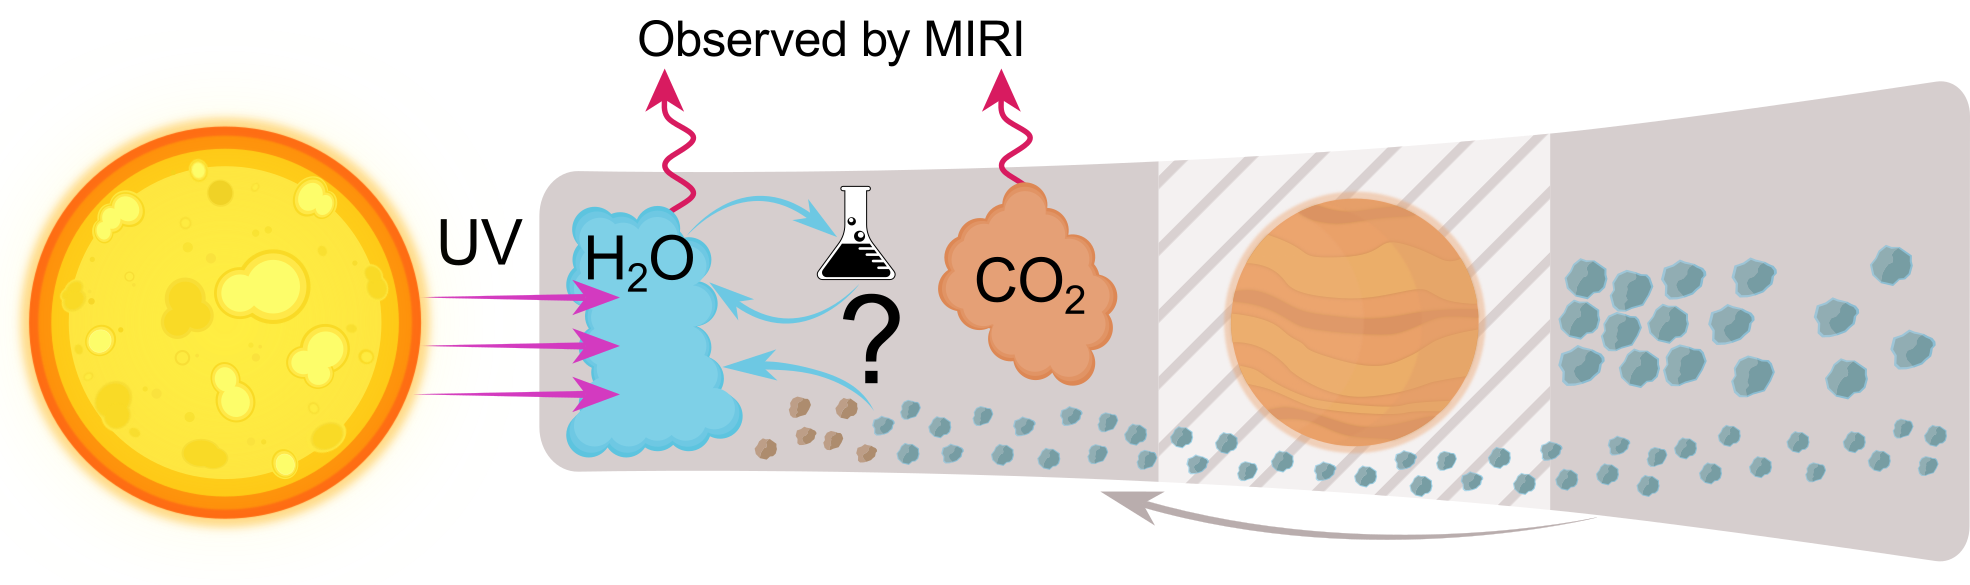
I created this diagram for an Astrobites article I wrote on the discovery of water around PDS 70. Giant planets block big pebbles from entering the inner disc, but small pebbles might sneak past. The presence of CO2 indicates self-shielding water, which protects the CO2 from being destroyed by stellar UV radiation.